€164.51
0.52% today
L&S, Jul 04, 10:54 pm CET
ISIN
US8725901040
Symbol
TMUS

T-Mobile US Stock price

$178.46
+5.38 3.11% 1M
+16.38 10.11% 6M
+18.13 11.31% YTD
+39.13 28.08% 1Y
+32.17 21.99% 3Y
+103.62 138.46% 5Y
+145.56 442.45% 10Y
Nasdaq, Closing price Wed, Jul 03 2024
-1.52 0.84%
ISIN
US8725901040
Symbol
TMUS

Key metrics

Market capitalization $209.13b
Enterprise Value $317.93b
PER (TTM) P/E ratio 24.28
EV/FCF (TTM) EV/FCF 31.28
EV/Sales (TTM) EV/Sales 4.05
P/S ratio (TTM) P/S ratio 2.66
P/B ratio (TTM) P/B ratio 3.38
Dividend yield 0.36%
Last dividend (FY23) $0.65
Revenue growth (TTM) Revenue growth -0.71%
Revenue (TTM) Revenue $78.52b
EBIT (operating result TTM) EBIT $15.69b
Free Cash Flow (TTM) Free Cash Flow $10.17b
Cash position $6.86b
EPS (TTM) EPS $7.35
P/E forward 19.54
P/S forward 2.61
EV/Sales forward 3.96
Short interest 4.90%
Show more

Create a Free Account to create an T-Mobile US alert.

Set up alerts on Stock Price, Dividend Yield, Valuation (e.g. P/E or EV/Sales) or Strategy Scores and sit back and relax.

T-Mobile US Stock Analysis

Analyst Opinions

29 Analysts have issued a T-Mobile US forecast:

25x Buy
86%
3x Hold
10%
1x Sell
3%

Analyst Opinions

29 Analysts have issued a T-Mobile US forecast:

Buy
86%
Hold
10%
Sell
3%

Financial data from T-Mobile US

Income Statement P&L | Balance Sheet | Cash Flow


Quarter TTM Annually
Mar '24
+/-
%
78,520 78,520
1% 1%
100%
- Direct Costs 42,064 42,064
5% 5%
54%
36,456 36,456
5% 5%
46%
- Selling and Administrative Expenses 7,784 7,784
0% 0%
10%
- Research and Development Expense - -
-
-
28,672 28,672
7% 7%
37%
- Depreciation and Amortization 12,986 12,986
2% 2%
17%
EBIT (Operating Income) EBIT 15,686 15,686
15% 15%
20%
Net Profit 8,751 8,751
129% 129%
11%

In millions USD.

Don't miss a Thing! We will send you all news about T-Mobile US directly to your mailbox free of charge.

If you wish, we will send you an e-mail every morning with news on stocks of your portfolios.

T-Mobile US Stock News

Positive
Investors Business Daily
about 2 hours ago
TMUS stock hit an all-time high in June. Here is what fundamental and technical analysis says about T-Mobile stock ahead of big October event.
Negative
InvestorPlace
2 days ago
The size of the 5G services market is expected to grow from $98.3 billion in 2023 to more than $427 billion by 2028. That equates to forecast compounding annual growth rates above 34% in that period.
Neutral
Business Wire
3 days ago
BELLEVUE, Wash.--(BUSINESS WIRE)--The Un-Carrier is bringing home some early wins as the most decorated 5G network in the country. Even the athletes headed to Paris are (probably) jealous of all our golds! T-Mobile (NASDAQ: TMUS) announced today it ranked first for all overall network experience metrics in Opensignal's latest USA Mobile Network Experience report. And in typical magenta fashion,...
More T-Mobile US News

Company Profile

T-Mobile US, Inc. engages in the provision of wireless communications services under the T-Mobile and MetroPCS brands. It offers postpaid and prepaid wireless voice, messaging and data services and wholesale wireless services. The company was founded in 1994 and is headquartered in Bellevue, WA.

Head office United States
CEO Mike Sievert
Employees 67,000
Founded 1994
Website www.t-mobile.com

Register for Free

StocksGuide is the ultimate tool for easily finding, analyzing and tracking stocks. Learn from successful investors and make informed investment decisions. We empower you to become a confident, independent investor.
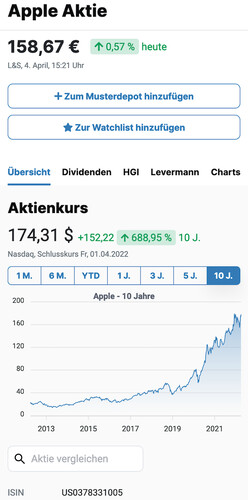
The Apple stock at a glance with charts, current key metrics, news and stock analyses.
The Best Dividend Stocks in the Dividend Top Scorer list.
Stock Analyses of the Best Stocks Worldwide.
Start building wealth today