Find Levermann Stocks
The ranking of the best stocks according to the Levermann strategy gives you an overview of all the key figures: Find the best Levermann stocks directly.

The Levermann strategy
The Levermann strategy is based on a quantitative analysis method described by former fund manager Susan Levermann in her book"The Relaxed Path to Wealth".
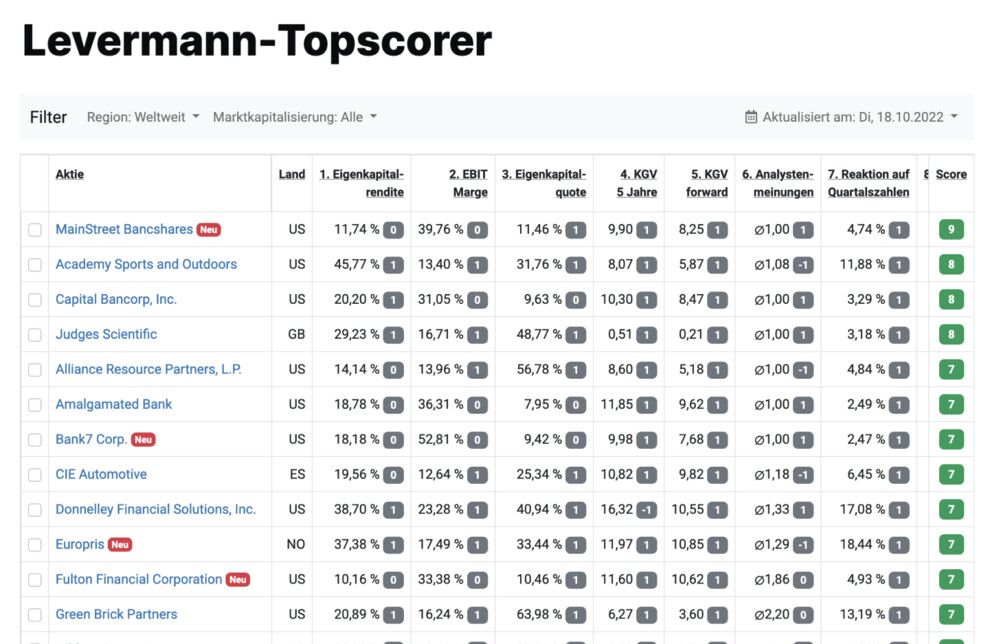
Levermann Top Scorer January 2026
| # | Stock | Price | Performance | Score | Analysis |
|---|---|---|---|---|---|
|
6.69
$
16.54%
10Y
|
|
||||
| 1 | 6.69 $ |
16.54%
10Y
|
7/13 | View | |
|
3.45
S$
1,428.58%
10Y
|
|
||||
| 2 | 3.45 S$ |
1,428.58%
10Y
|
7/13 | View | |
|
94.70
€
184.21%
10Y
|

|
||||
| 3 | 94.70 € |
184.21%
10Y
|
6/13 | View | |
|
677,000.00
₩
2,374.56%
10Y
|

|
||||
| 4 | 677,000.00 ₩ |
2,374.56%
10Y
|
6/13 | View | |
|
406.00
€
2,206.82%
10Y
|
|
||||
| 5 | 406.00 € |
2,206.82%
10Y
|
6/13 | View |
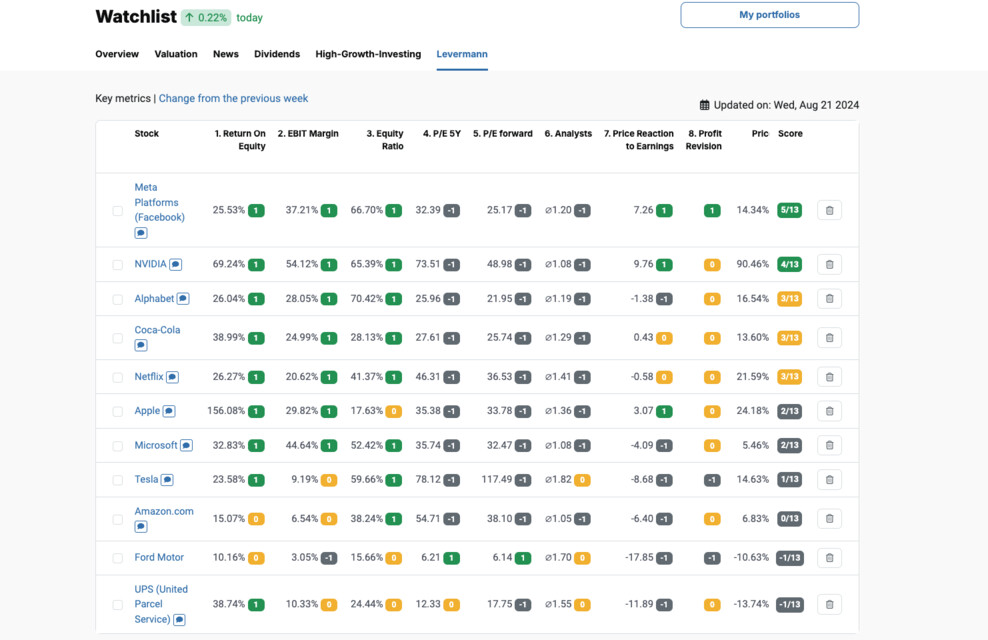

How StocksGuide calculates the Levermann score
The investment strategy evaluates a share on the basis of 13 criteria that have led to above-average performance in the past.
One of the following values is awarded for each criterion: +1 point, 0 points, -1 point. The total number of points results in the Levermann score, which is used to classify a stock as "buy", "hold" or "sell". The book recommends buying quality stocks that score at least 4 points if they are large caps. Small and mid caps should even score at least 7 points, as smaller companies are exposed to higher risks.
These stocks are included as Top Scorers in the Levermann Top List.
The criteria in detail
1. Return on equity
The return on equity (RoE) describes the ratio of profit to equity. It indicates the return on a company's equity within an accounting period. A shareholder can use the return on equity to recognize how profitable their investment in the company is.
Points distribution
- +1 pts.
- > 20%
- -1 pts.
- < 10%
- 0 pts.
- 10% ... 20%
2. EBIT Margin
EBIT (earnings before interest and taxes) is earnings before interest and taxes, also known as the operating result. The EBIT margin is the ratio of EBIT to sales.
High EBIT Margins are a quality criterion for investment risk. The higher the EBIT Margin, the easier it is to absorb declines in sales economically. EBIT is not applicable for financial stocks. Therefore, 0 points are always awarded for financial stocks in the Levermann model.
Points distribution
- +1 pts.
- > 12%
- -1 pts.
- < 6%
- 0 pts.
- 6% ... 12%
3. Equity ratio
The equity ratio is the ratio of equity to total capital (balance sheet total). The equity ratio provides information about a company's creditworthiness. The requirements for a positive rating are lower for financial stocks because they have a high proportion of borrowed capital due to their business model.
Distribution of points for financial values
- +1 pts.
- > 10%
- -1 pts.
- < 5%
- 0 pts.
- 5% ... 10%
Point distribution for non-financials
- +1 pts.
- > 25%
- -1 pts.
- < 15%
- 0 pts.
- 15% ... 25%
4. P/E ratio 5 years
The price-earnings ratio (PER) describes the ratio of the share price to the earnings per share given or expected for the comparison period.
It indicates after how many years you have doubled your stake, assuming that the profit remains constant. It is therefore a good indicator of whether a share is expensive or cheap.
For the average P/E ratio over 5 years, the figures from the past 3 financial years and the expected figures for the current and next financial year are used.
Points distribution
- +1 pts.
- > 0..12
- -1 pts.
- > 16 or < 0 or N/A
- 0 pts.
- 12..16
5. P/E ratio forward
The price-earnings ratio (PER) describes the ratio of the share price to the earnings per share given or expected for the comparison period. The decisive factor here is the PER estimated by analysts for the current financial year.
Points distribution
- +1 pts.
- > 0..12
- -1 pts.
- > 16 or < 0
- 0 pts.
- 12..16
6. Analyst opinions
Stocks are rated by analysts on a 3-level scale: Buy=1, Hold=2, Sell=3. We calculate and evaluate the average value of all opinions.
The opinions of analysts reflect a majority opinion that no longer contain any surprises and therefore do not entail any major price potential. According to Levermann, the analysts' majority opinion is therefore used as a contra-indicator, i.e. there is a plus point if the majority of analysts say "sell" and a minus point if the majority of analysts say "buy".
For small caps with a maximum of 5 analyses, the analysts' opinion is classified as credible according to Levermann. This means that there is a plus point if the majority of analysts say "buy" and a minus point if the majority of analysts say "sell".
Distribution of points for small caps
- +1 pts.
- ∅ <= 1.5
- -1 pts.
- ∅ >= 2.5
- 0 pts.
- 1.5 < ∅ < 2.5
Otherwise
- +1 pts.
- ∅ >= 2.5
- -1 pts.
- ∅ <= 1.5
- 0 pts.
- 1.5 < ∅ < 2.5
7. Reaction to quarterly figures
The change in the share price in relation to the reference index on the day the last quarterly figures were published is calculated.
Points distribution
- +1 pts.
- > 1%
- -1 pts.
- < -1%
- 0 pts.
- -1%..1%
8. Profit revision
It calculates how analysts' expectations for earnings per share (EPS) have changed in the last 4 weeks for the current and the coming financial year. To do this, the current value for earnings per share is set in relation to the value from 4 weeks ago.
Points distribution
- +1 pts.
- > 5%
- -1 pts.
- < -5%
- 0 pts.
- -5%..5%
9. Price today vs. price 6 months ago
The key figure defines the percentage by which the share price has changed in the last 6 months.
Points distribution
- +1 pts.
- > 5%
- -1 pts.
- < -5%
- 0 pts.
- -5%..5%
10. Price today vs. price 1 year ago
The key figure defines the percentage by which the share price has changed in the last year.
Points distribution
- +1 pts.
- > 5%
- -1 pts.
- < -5%
- 0 pts.
- -5%..5%
11. Price momentum rising
The key figure defines whether there has been a trend reversal in the last 6 months compared to the entire previous year.
Points distribution
| +1 pts. | Criterion 9: 1 point, criterion 10: 0 or -1 point. |
|---|---|
| -1 pts. | Criterion 9: -1 point, criterion 10: 0 or 1 point. |
| 0 pts. | otherwise |
12. Three-month reversal
The indicator calculates how a share has performed in relation to the benchmark index for 3 consecutive months. The indicator is only calculated for large caps.
Points distribution for large caps
| +1 pts. | Perf. in each month < benchmark index |
|---|---|
| -1 pts. | Perf. in each month > Benchmark index |
| 0 pts. | otherwise |
13. Profit growth
The estimated earnings per share (EPS) for the next financial year (FY) are compared with the estimated earnings per share for the current financial year (FY).
Points distribution for large caps
| +1 pts. | EPS NJ - EPS AJ > 5% |
|---|---|
| -1 pts. | EPS NJ - EPS AJ < -5% |
| 0 pts. | otherwise |
Use the most powerful way to find The Best Stocks using the Levermann Strategy.
The implementation of the Levermann Strategy is more efficient and promising with StocksGuide.
Clear analysis
Real-time quotes
Levermann analyses
Stock Screener
Real-time quotes
Levermann analyses
Stock Screener
Top scorer analyses
Our experts take a closer look at current top scorers according to the Levermann, High Growth Investing and Dividend strategies.


Register now for free to access more top scorer analyses.
Get Started for Free TodayStocks by index
USA
Germany
Europe

Stocks by sector
Register for Free
StocksGuide is the ultimate tool for easily finding, analyzing and tracking stocks. Learn from successful investors and make informed investment decisions. We empower you to become a confident, independent investor.


