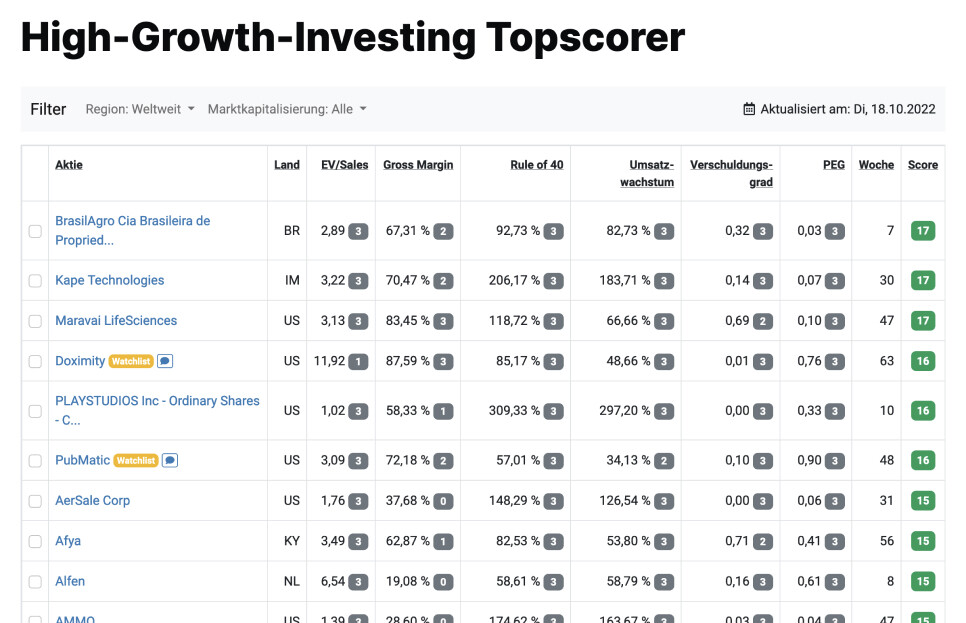
Finding high-growth stocks
This ranking of stocks with high growth potential gives you an overview of all the key figures: Find the best growth stocks directly.
The High-Growth-Investing Strategy
The High-Growth-Investing Strategy (HGI strategy) is a long-term stock-picking strategy for growth companies. It is described by software entrepreneur Stefan Waldhauser in his e-book"Fundamentals of the High-Growth Investing Strategy".
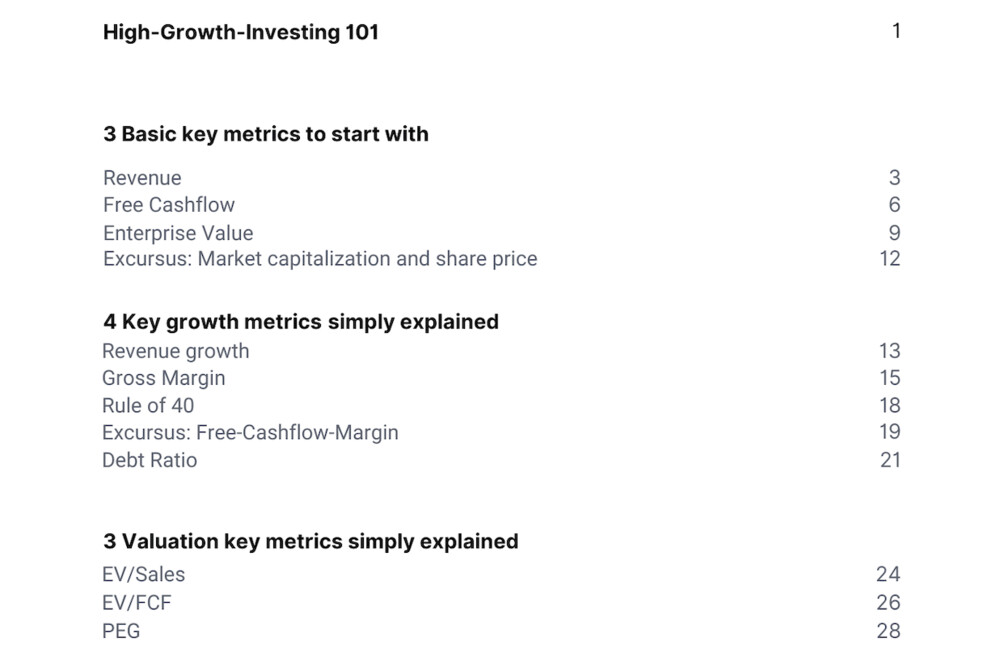
The e-book on the HGI strategy
Want to find the best growth stocks? Then you need the right key figures.
You will find all the key figures of the HGI strategy explained in this e-book (with practical examples). You can download the free e-book here.
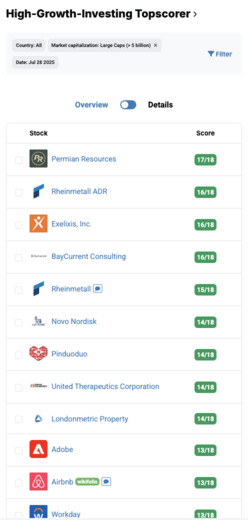
High-Growth-Investing Top Scorer November 2025
| # | Stock | Price | Performance | Score | Analysis |
|---|---|---|---|---|---|
|
6,756.00
¥
3,405.97%
10Y
|
|
||||
| 1 | 6,756.00 ¥ |
3,405.97%
10Y
|
16/18 | View | |
|
3,807.00
¥
2,422.31%
10Y
|
|
||||
| 2 | 3,807.00 ¥ |
2,422.31%
10Y
|
16/18 | View | |
|
168.01
$
20.86%
5Y
|
|
||||
| 3 | 168.01 $ |
20.86%
5Y
|
16/18 | View | |
|
312.40
$
837.29%
10Y
|

|
||||
| 4 | 312.40 $ |
837.29%
10Y
|
13/18 | View | |
|
1,467.11
CN¥
7,298.59%
10Y
|

|
||||
| 5 | 1,467.11 CN¥ |
7,298.59%
10Y
|
12/18 | View |
What characterizes StocksGuide's High Growth Investing Strategy?
The High-Growth Investing strategy uses a set of metrics to filter out the outstanding companies from an investment universe of fast-growing companies - even if they are not yet profitable.
1. Step
First, an HGI Score is calculated for the entire StocksGuide investment universe (7,048 worldwide stocks) for each share using a simple points system.
The HGI Score is made up of 6 criteria, for each of which 0 to 3 points are awarded. A share can therefore receive a maximum of 18 points in total.
The HGI Score at a glance:
| Criterion | 3 points | 2 points | 1 point |
|---|---|---|---|
| EV/Sales EV/Sales | ≤ 8 | > 8 and ≤ 10 | > 10 and ≤ 12 |
| Gross Margin (TTM) Gross Margin | ≥ 75% | < 75% and ≥ 65% | < 65% and ≥ 50% |
| Rule of 40 (TTM) Rule of 40 | ≥ 50% | < 50% and ≥ 45% | < 45% and ≥ 40% |
| Sales growth (TTM) Sales growth | ≥ 40% | < 40% and ≥ 30% | < 30% and ≥ 20% |
| Debt-equity ratio Debt-equity ratio | ≤ 0,5 | > 0.5 and ≤ 1 | > 1 and ≤ 1.5 |
| PEG (TTM) PEG | > 0 and < 1 | ≥ 1 and < 2 | ≥ 2 and < 4 |
2. Step
For the Top Scorer List, only those stocks that achieve an HGI Score of at least 11 points AND meet the following additional conditions are then displayed in a second step:
Growth rate last 3 years > 10% each
Turnover last 12 months > € 100 million
Market capitalization > € 300 million
We also exclude stocks from the biotechnology, financials, commodities and oil industry sectors, as the HGI ratio analysis does not fit well with these sectors. An unfiltered list of all Top Scorers including these sectors can be viewed here.
3. Step
Our team of experts analyzes the stocks that appear on the Top Scorer List and publishes a quick check for selected stocks. Particularly promising stocks are added to Stefan's watchlist (premium feature) or even to the High-Tech Stock Picking wikifolio following further analysis.
Use the most powerful way to find upcoming Tenbagger.
Implementing your High-Growth-Strategy is more efficient and promising with StocksGuide.
The criteria in detail
EV/Sales current
Enterprise value (EV) is a measure of the value of a company on the stock exchange. It is derived from market capitalization (i.e. the value of all stocks on the stock exchange) as follows:
EV = market capitalization - cash + debt
If you divide enterprise value by turnover, you obtain an important key figure for assessing the valuation of fast-growing companies. This key figure can also be meaningfully calculated for companies that are still loss-making.
Gross Margin (TTM)
The gross margin is the percentage of sales that remains with the company after deducting direct production costs.
Gross margin (%) = (sales - direct costs) / sales
The gross margin provides a good indication of the profitability of a business model. The higher the percentage, the more money a company has available for sales+marketing, research+development, administration, covering the cost of capital and generating an operating profit.
Rule-of-40 Score (TTM)
The Rule of 40 is a simple indicator for assessing the efficiency of a company's growth and thus the quality of its business model.
The key figure is calculated as the sum of sales growth (in %) and the free cash flow margin (in %) - in each case based on the figures for the past 12 months.
Rule of 40 Score (%) = sales growth TTM (%) + free cash flow margin TTM (%)
The higher the value, the better the company's business model. Values above 40% are considered attractive. This key figure can also be meaningfully calculated for companies that are still in deficit.
Sales Growth (TTM)
The sales growth rate TTM (Trailing Twelve Months) compares the sales of the last 12 months with the sales of the previous 12 months.
A sales growth rate of at least 20% is considered attractive.
Of particular interest is the company's organic growth - i.e. adjusted for any major acquisitions. In the case of extreme one-off jumps in sales, it should always be questioned whether this is due to an acquisition.
Debt-equity ratio
The gearing ratio is calculated by putting the sum of current and non-current liabilities in relation to equity. The most recent quarterly figures are used for the calculation.
A leverage ratio of less than 1 indicates a low level of debt, while a leverage ratio greater than 2 indicates possible risks from the debt.
PEG (TTM)
The price/earnings growth ratio (PEG) describes the relationship between the price/earnings ratio (P/E ratio) and the growth in operating profits - in each case based on the figures for the past 12 months.
PEG (TTM) = P/E ratio / (earnings last 4 quarters / earnings previous 4 quarters)
A PEG of less than 1 indicates an undervaluation. The PEG can only be meaningfully calculated for companies that are already sustainably profitable.
3-year sales growth
Sales for the last 3 financial years are compared with sales in the previous year.
The High-Growth Investing strategy is only interested in companies that have grown by more than 10% in each of the last 3 financial years.
The aim is to identify one-off leaps in sales and only select those companies that can demonstrate steady, organic double-digit growth.
Clear analysis
Real-time quotes
High-growth analyses
Stock Screener
Real-time quotes
High-growth analyses
Stock Screener
Top scorer analyses
Our experts take a closer look at current top scorers according to the Levermann, High Growth Investing and Dividend strategies.


Register now for free to access more top scorer analyses.
Get Started for Free TodayRegister for Free
StocksGuide is the ultimate tool for easily finding, analyzing and tracking stocks. Learn from successful investors and make informed investment decisions. We empower you to become a confident, independent investor.


