Find the best
Dividend Stocks
The ranking of the Best Dividend Stocks gives you an overview of all the key figures: Find the stocks with the highest dividends directly, share analyses and clear dividend lists.

Dividend Strategy for Stocks
Successful investors follow a clear strategy. The StocksGuide dividend strategy is a long-term stock-picking strategy for companies with outstanding dividend ratios.
We go beyond simply looking at the stocks with the highest current dividend yield. Do you want to know which stock you should invest in? Our dividend score gives you a good basis for deciding which dividend stocks to invest in.
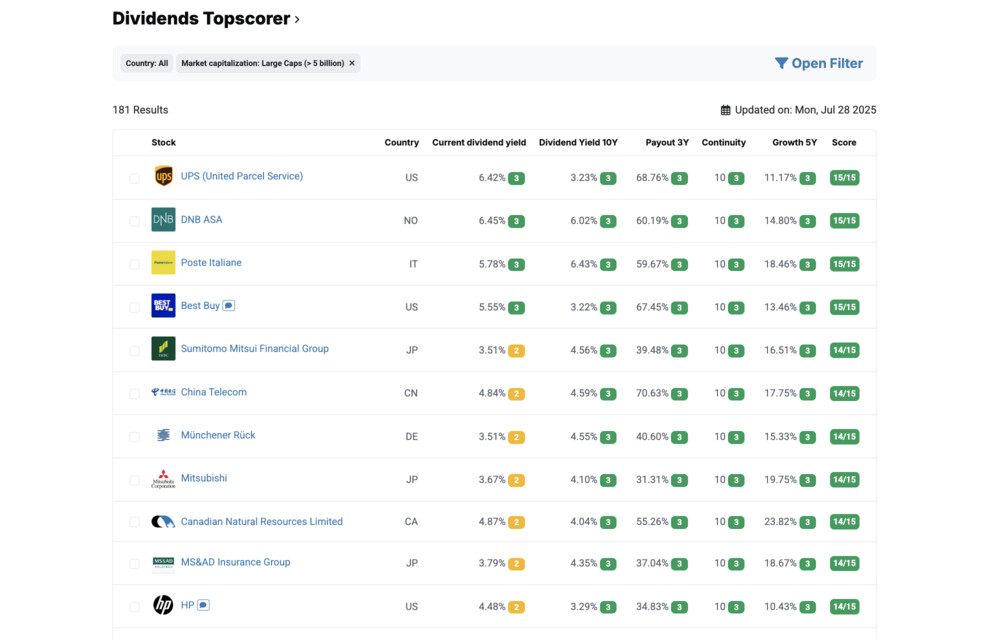
Dividends Top Scorer January 2026
| # | Stock | Price | Performance | Score | Analysis |
|---|---|---|---|---|---|
|
5.47
HK$
83.87%
10Y
|
15/15 | ||||
| 1 | 5.47 HK$ |
83.87%
10Y
|
15/15 | View | |
|
105.22
$
39.86%
10Y
|
15/15 | ||||
| 2 | 105.22 $ |
39.86%
10Y
|
15/15 | View | |
|
531.80
€
368.13%
10Y
|
14/15 | ||||
| 3 | 531.80 € |
368.13%
10Y
|
14/15 | View | |
|
156.54
$
164.20%
10Y
|
13/15 | ||||
| 4 | 156.54 $ |
164.20%
10Y
|
13/15 | View | |
|
8.26
HK$
31.66%
10Y
|
13/15 | ||||
| 5 | 8.26 HK$ |
31.66%
10Y
|
13/15 | View |

How we value Dividend Stocks
The dividend strategy uses a series of key figures that are suitable for filtering out the best dividend companies from the StocksGuide investment universe of 7,084 stocks. It is based on the book "Stay cool and collect dividends: Get out of the zero interest trap with stocks" by Christian W. Röhl.
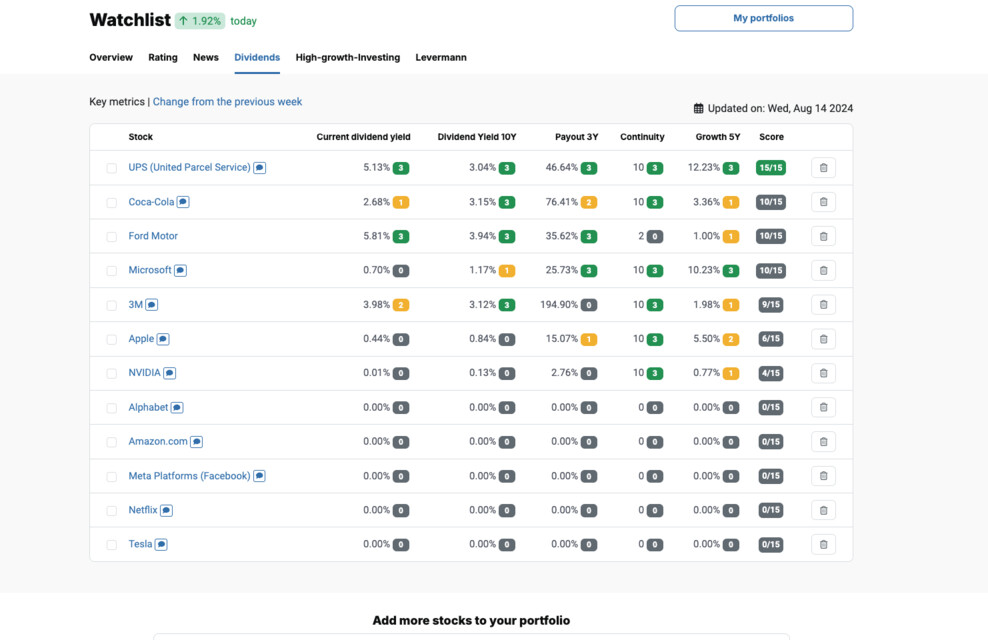
A score between 0 and 3 points is awarded for each key figure, with 3 being the maximum. The score for all key figures is added together to give an overall score. Stocks with a total score of 12 or more are included in the dividend Top Scorer List.
The criteria in detail
Current dividend yield
The current dividend yield is calculated as the quotient of the last annual dividend and the last closing price.
Points distribution
- 3 pts.
- ≥ 5 %
- 2 pts.
- ≥ 3,5 %
- 1 pts.
- ≥ 2 %
Dividend Yield 10Y
The 10-year dividend yield describes the average dividend yield over the past 10 financial years. It is calculated as the quotient of the average dividend payment and the average closing price on the stock exchange over the last 10 financial years.
Points distribution
- 3 pts.
- ≥ 3 %
- 2 pts.
- ≥ 2 %
- 1 pts.
- ≥ 1 %
Payout 3Y
Payout 3 years is the payout ratio smoothed over three years. It is calculated by dividing the total of all dividend payments for the last three financial years by the cumulative earnings per share for the three corresponding reference years.
Points distribution
- 3 pts.
- ≥ 25 % and ≤ 75 %
- 2 pts.
- ≥ 20 % and ≤ 80 %
- 1 pts.
- ≥ 15 % and ≤ 85 %
Continuity 10Y
The 10-year continuity describes how many consecutive years the company has not reduced its annual dividend in the past 10 financial years.
Points distribution
- 3 pts.
- ≥ 10 years
- 2 pts.
- ≥ 8 years
- 1 pts.
- ≥ 5 years
Growth 5 years
Growth 5 years refers to the average annual dividend growth (compound annual growth rate) over the past five financial years.
Points distribution
- 3 pts.
- > 10 %
- 2 pts.
- > 5 % and ≤ 10 %
- 1 pts.
- > 0% and ≤ 5 %
Use our handy features to find the best dividend-paying stocks.
Implementing your dividend strategy is more efficient and more promising with StocksGuide.
What distinguishes StocksGuide's dividend analysis?
If you want to find the best dividend stocks - also known as Dividend Aristocrats - you need a reliable database. We have therefore integrated several data sources for the StocksGuide. We have linked these with our own algorithm. We are particularly pleased that we have created the possibility of quickly correcting incorrect dividend data in our own database.
Clear analysis
Top scorer analyses
Our experts take a closer look at current top scorers according to the Levermann, High Growth Investing and Dividend strategies.
Register now for free to access more top scorer analyses.
Get Started for Free TodayInterpreting dividends correctly
The total return on the stock market is made up of price gains and dividends. Dividend distributions in particular promise a regular income. In times of low interest rates, the dividend strategy is probably the most popular strategy among private investors.
The search for stocks with the highest dividends
So are dividends the new interest? Not necessarily, because we must not forget: Dividends are part of a profit distribution from an entrepreneurial investment. It is not a good idea to simply invest in the companies that currently offer the highest dividend yields. This is because the payment of a dividend must be generated anew each year. If a dividend payment has to be suspended, popular dividend stocks often lose a disproportionate amount of value in a short period of time.
Are dividends safe?
Depending on the company, dividends are paid out either annually, semi-annually, quarterly or monthly. In order to receive a dividend, you should generally own the share before the ex-dividend date. The historical data can be found in the dividend calendar for each share on StocksGuide.
However, as the dividend is part of a company's profit distribution, a dividend payment is not guaranteed. A dividend adjustment is often announced before the end of the financial year or quarter if the profit outlook changes. This can be a dividend increase, a special dividend, but also a dividend reduction or even a complete suspension of the dividend payment.
StocksGuide offers dividend estimates to help you assess stock and dividend trends.
Finding sustainable dividend payers
Regardless of whether you call them dividend pearls or Dividend Aristocrats. Anyone investing in dividend stocks is looking for long-term stable dividends with high dividend yields. The StocksGuide dividend strategy therefore looks at key figures from the last 3, 5 and 10 years. The score reflects a solid growth forecast. The stocks with the highest dividends therefore do not necessarily have the highest dividend score.
Why is the continuity of dividend payments important?
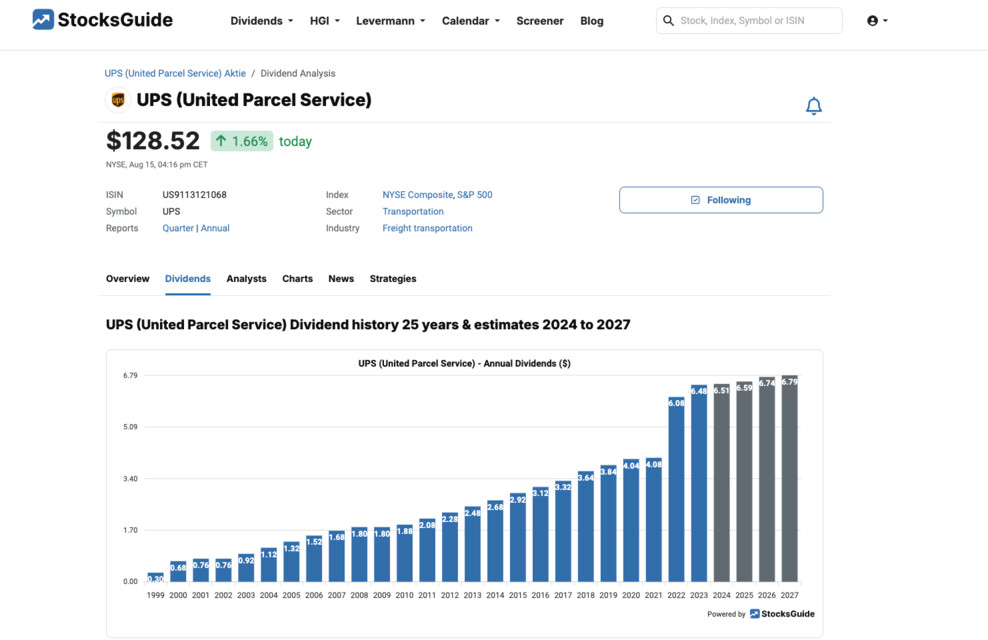
A high dividend is not the only thing that counts in the long term. Companies that continuously pay out dividends without cutting them are often very solid investments. If the dividend is also regularly increased, this speaks for a functioning business model. The dividend trend can be seen from the calculated continuity ratio and the dividend history.
Compare stocks before buying (dividend needle)
Would you like to compare further figures for your stock strategy in addition to our score? We offer extensive comparisons of the best dividend stocks for analysis. There we highlight some other dividend key figures: Dividend growth 1, 5 and 10 years, dividend yield 5 years, payout ratio: 1 and 3 years and dividend series (dividend increases, dividend continuity, dividend payments. The large number of key figures is updated daily.
Fundamental data of all dividend stocks
The following questions are also answered in the detailed analysis of all stocks that pay dividends:
Dividend history: How high has the dividend been in recent years?
Dividend calendar: When were dividends paid?
Dividends: What is the dividend, dividend yield, payout ratio and dividend growth?
Forecast: What is the expected development?
Continuity: How secure is the dividend payment?
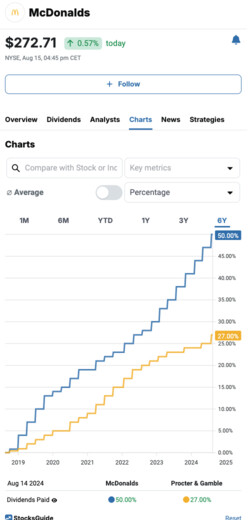
However, analyzing according to the dividend strategy is only part of the data and functions available on StocksGuide. With our charts, you can take your stock analysis to a whole new level.


You will find
- The Best German Dividend Stocks
- The Best US Dividend Stocks
- Dividend Stocks Worldwide
- Dividend Calendar
everything at a glance.
We thus offer the most comprehensive dividend data for a valuation of the top dividend stocks.
Register for Free
StocksGuide is the ultimate tool for easily finding, analyzing and tracking stocks. Learn from successful investors and make informed investment decisions. We empower you to become a confident, independent investor.


