Finding the Best
Stocks Made Easy
Find top stocks with AI support and proven investment strategies, learn from successful investors, make confident decisions, and outperform the market over the long term.

Strategies to Outperform the Market
Start with a strategy that fits your goals – supported by AI-based analyses and intelligent tools.
Discover
Analyze
Monitor
Discover
Analyze
Monitor
StocksGuide offers you
stock analyses for
Over 3 million investors worldwide trust StocksGuide


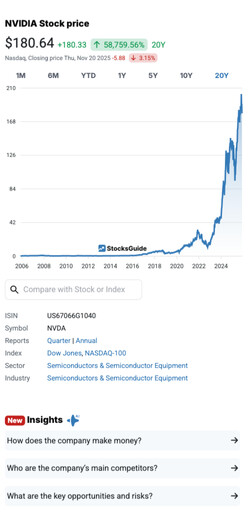
AI-Insights

Intelligent support where it counts: our AI identifies investment opportunities early on, analyzes business models, and accurately assesses risks. It shows you what's behind price movements, provides insights like a pro, and makes analyses easy to understand. This allows you to make clearer decisions and implement your strategy more precisely.
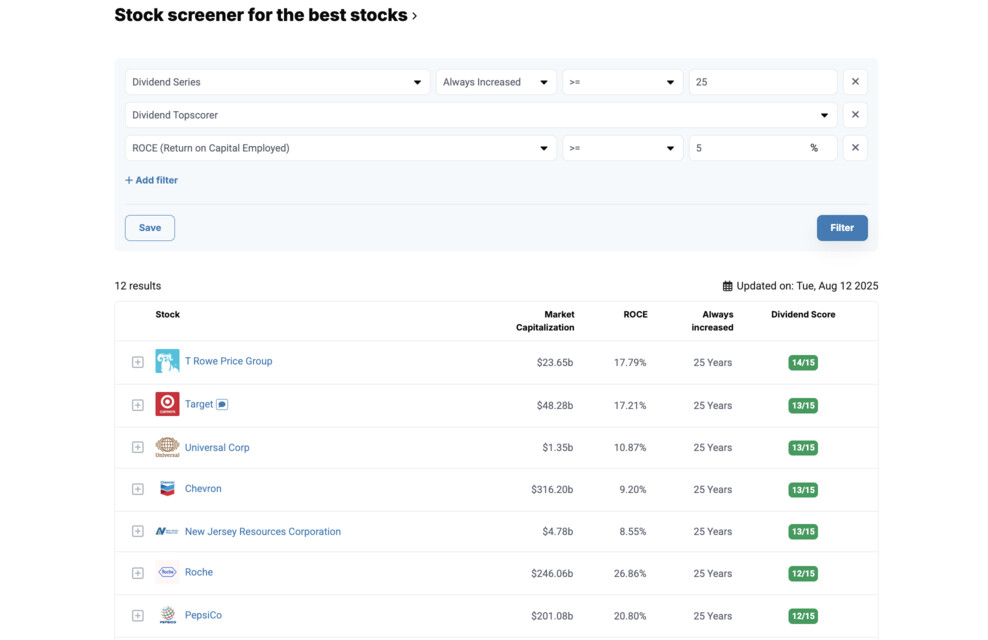
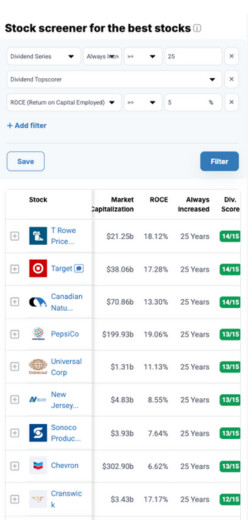
Stock Screener
Discover a new level of ease and intuition in screening global stocks on your smartphone or PC. With our top-performing stocks and your criteria, you can find the best stocks — and easily save your screenings.
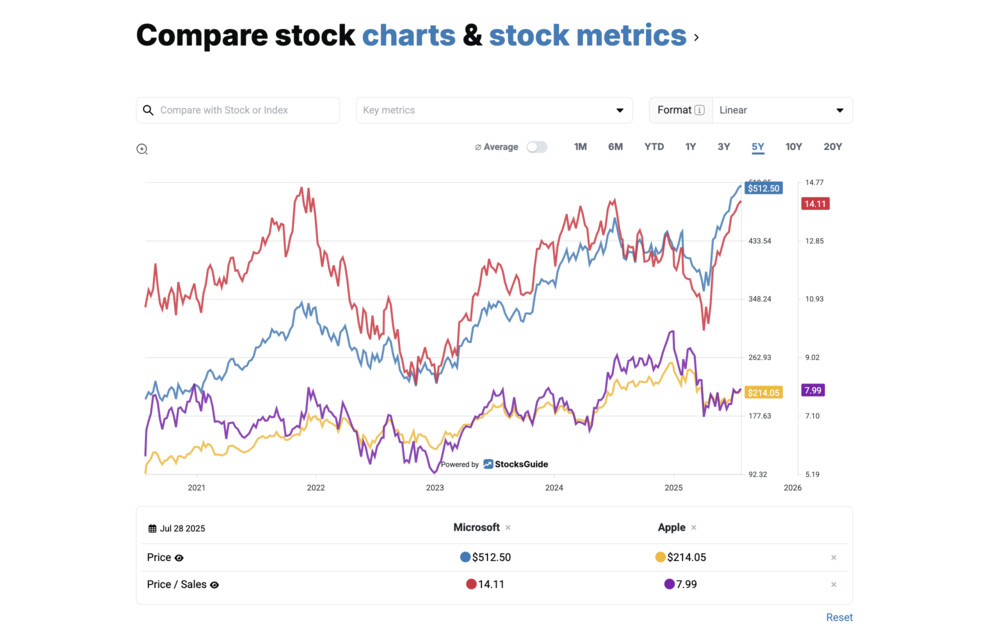
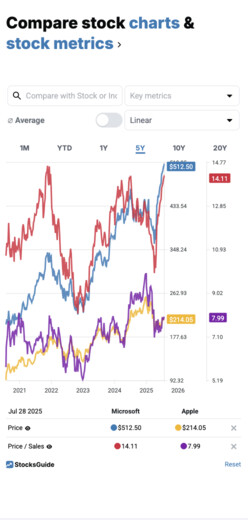
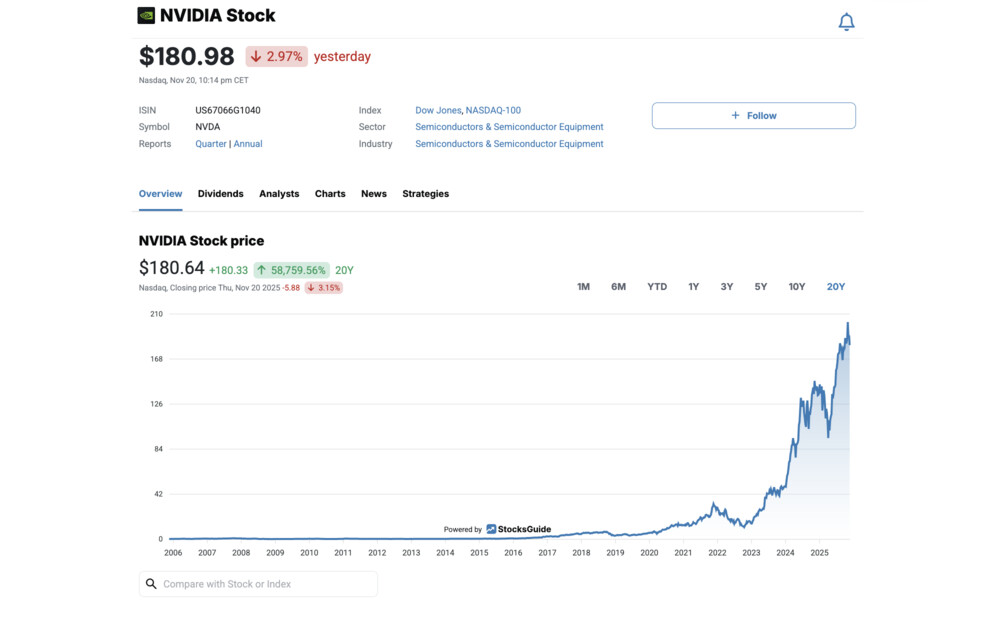
Visualize & Compare
Use our chart tool to visualize a stock with various metrics and display formats – with up to 20 years of data history.
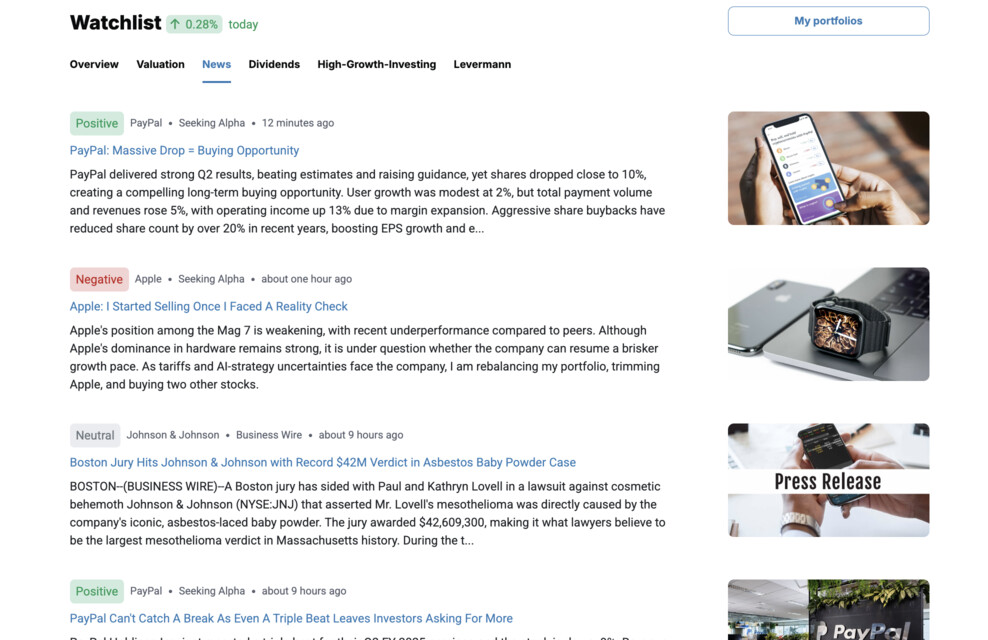
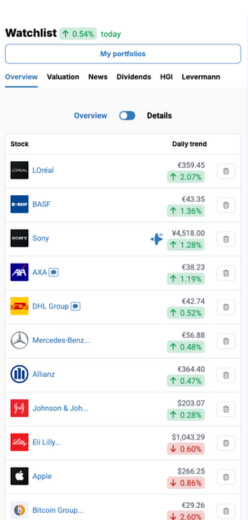
Portfolios & Watchlist
Always stay on top of your portfolios and watchlists. With real-time prices, valuation summaries, and aggregated news, instantly spot overvalued and undervalued stocks in your portfolios.
The Strategies
Successful investors follow a clear investment strategy. Learn how to leverage their proven performance indicators for your own stock selection.
High-Growth-Investing
Dividend Strategy
Levermann strategy
Current Top Scorers
| # | Stock | Price | Performance | Score | Analysis |
|---|---|---|---|---|---|
|
5.47
HK$
83.87%
10Y
|
|
||||
| 1 | 5.47 HK$ |
83.87%
10Y
|
15/15 | View | |
|
105.22
$
39.86%
10Y
|

|
||||
| 2 | 105.22 $ |
39.86%
10Y
|
15/15 | View | |
|
531.80
€
368.13%
10Y
|
|
||||
| 3 | 531.80 € |
368.13%
10Y
|
14/15 | View | |
|
156.54
$
164.20%
10Y
|
|
||||
| 4 | 156.54 $ |
164.20%
10Y
|
13/15 | View | |
|
8.26
HK$
31.66%
10Y
|
|
||||
| 5 | 8.26 HK$ |
31.66%
10Y
|
13/15 | View |
| # | Stock | Price | Performance | Score | Analysis |
|---|---|---|---|---|---|
|
4,957.00
¥
718.52%
10Y
|
|
||||
| 1 | 4,957.00 ¥ |
718.52%
10Y
|
18/18 | View | |
|
3,734.00
¥
1,964.47%
10Y
|
|
||||
| 2 | 3,734.00 ¥ |
1,964.47%
10Y
|
16/18 | View | |
|
178.94
$
28.72%
5Y
|
|
||||
| 3 | 178.94 $ |
28.72%
5Y
|
16/18 | View | |
|
148.81
$
813.84%
10Y
|
|
||||
| 4 | 148.81 $ |
813.84%
10Y
|
14/18 | View | |
|
1,428.01
CN¥
7,168.30%
10Y
|

|
||||
| 5 | 1,428.01 CN¥ |
7,168.30%
10Y
|
13/18 | View |
| # | Stock | Price | Performance | Score | Analysis |
|---|---|---|---|---|---|
|
6.85
$
12.22%
10Y
|
|
||||
| 1 | 6.85 $ |
12.22%
10Y
|
7/13 | View | |
|
3.56
S$
1,477.32%
10Y
|
|
||||
| 2 | 3.56 S$ |
1,477.32%
10Y
|
7/13 | View | |
|
92.80
€
175.78%
10Y
|

|
||||
| 3 | 92.80 € |
175.78%
10Y
|
6/13 | View | |
|
726,000.00
₩
2,746.73%
10Y
|

|
||||
| 4 | 726,000.00 ₩ |
2,746.73%
10Y
|
6/13 | View | |
|
448.00
€
2,445.45%
10Y
|
|
||||
| 5 | 448.00 € |
2,445.45%
10Y
|
6/13 | View |
Top scorer analyses
Our experts take a closer look at current top scorers according to the Levermann, High Growth Investing and Dividend strategies.


Register now for free to access more top scorer analyses.
Get Started for Free TodayRegister for Free
StocksGuide is the ultimate tool for easily finding, analyzing and tracking stocks. Learn from successful investors and make informed investment decisions. We empower you to become a confident, independent investor.


